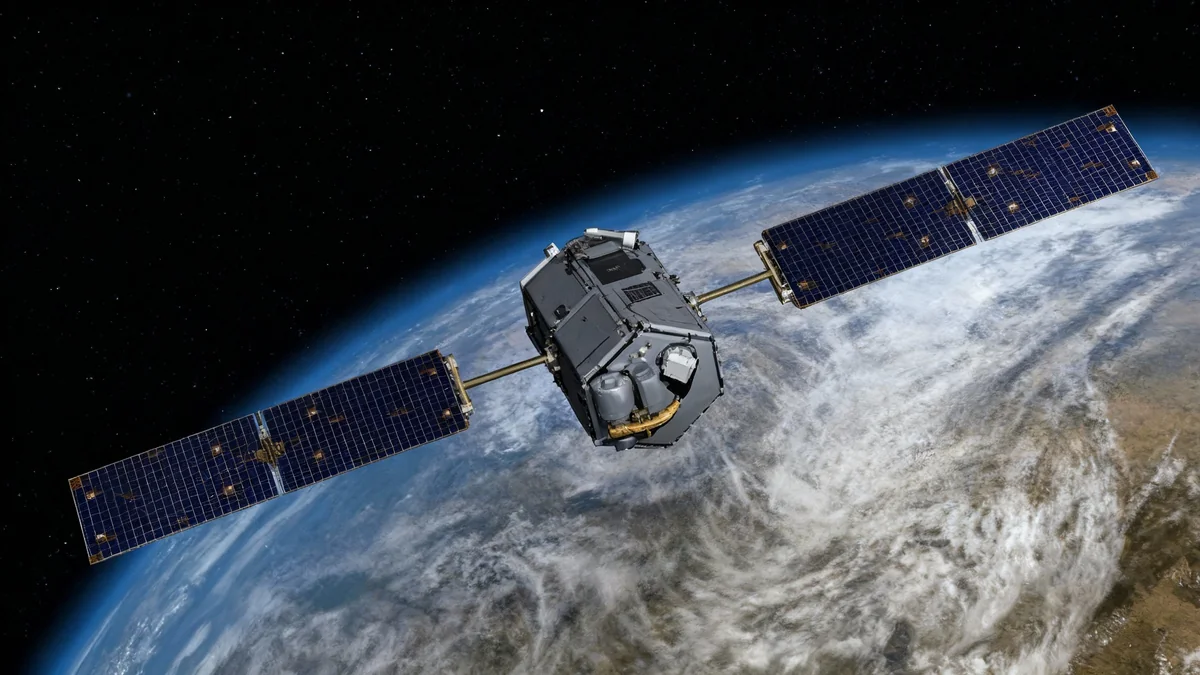
The World Bank has launched a groundbreaking public dataset that uses satellite technology to monitor carbon dioxide and methane emissions for over 6,600 cities worldwide. This new tool provides high-resolution, real-time data, offering an unprecedented view of urban pollution and empowering local governments to take targeted climate action.
For the first time, policymakers, researchers, and the public can access consistent and comparable emissions data for thousands of urban areas, addressing a critical information gap, particularly in the Global South where such monitoring has been historically scarce.
Key Takeaways
- A new public dataset from the World Bank tracks CO₂ and methane emissions for 6,672 cities globally.
- The system uses data from NASA's OCO-2 and the European Space Agency's Sentinel-5P satellites.
- It provides high-resolution data to help cities identify pollution hotspots and measure the effectiveness of climate policies.
- This initiative aims to address the fact that cities are responsible for approximately 70% of global carbon emissions.
An Unprecedented Global View of Urban Pollution
Cities are major contributors to global greenhouse gas emissions, accounting for an estimated 70% of all carbon dioxide (CO₂) output. Despite this, many municipal governments have struggled to accurately measure their environmental footprint due to a lack of localized data. A new initiative is set to change that.
By leveraging advanced satellite technology, a comprehensive dataset now tracks both CO₂ and anthropogenic methane (CH₄) levels across 6,672 urban centers. This publicly accessible information provides a standardized method for comparing emissions trends across different regions and over time.
This development is particularly significant for cities in developing nations, which have often lacked the resources for ground-based monitoring systems. Now, they have a powerful tool to understand their emissions profiles and design effective reduction strategies.
By the Numbers
- 6,672 urban areas are monitored worldwide.
- 70% of global CO₂ emissions originate from cities.
- Data is processed into 5 km grid cells for high-resolution analysis.
How Satellites Measure City Emissions
The new dataset is built on observations from two powerful orbital instruments: NASA’s OCO-2 satellite, which measures carbon dioxide, and the European Space Agency’s (ESA) Sentinel-5P satellite, which tracks methane.
These satellites provide daily readings with enough precision to capture atmospheric gas concentrations over major urban areas. To ensure the data reflects city-specific activities, analysts have developed a sophisticated processing method.
Filtering the Noise
A key step involves removing "background" values from the satellite readings. This process isolates the emissions directly linked to urban activity—such as traffic, industry, and energy consumption—from the baseline levels of gases naturally present in the atmosphere.
The refined data is then averaged into 5-kilometer grid cells. In regions with persistent cloud cover, which can obstruct satellite views, an adaptive spatial averaging technique is used to maintain data coverage without sacrificing local detail. This ensures that the information remains reliable and consistent across the globe.
What is a Performance Score?
To make the data easily understandable, each urban area is assigned a performance score ranging from –100 (indicating all significant decreases in emissions) to +100 (all significant increases). This allows for quick comparisons of emissions trends between different cities.
From Data to Direct Climate Action
The primary goal of this initiative is to equip city leaders with the actionable intelligence needed to combat climate change effectively. With detailed, location-specific data, officials can pinpoint emission hotspots, understand the sources of pollution, and evaluate the success of their environmental policies.
For example, analysis of 138 large cities in Southeast Asia using this data revealed sharply different emissions patterns even within the same geographic region. This highlights the need for tailored, local strategies rather than one-size-fits-all solutions.
"By making it openly accessible, we aim to equip policymakers, researchers, and the public with a practical tool for tracking progress, identifying problem areas, and designing effective interventions."
A city might use the data to see if introducing a low-emission zone for vehicles has actually reduced CO₂ levels in its downtown core. Similarly, it could track methane spikes to identify potential leaks in natural gas infrastructure or issues with waste management facilities.
The Future of Environmental Monitoring
While the initial focus is on carbon dioxide and methane, the potential applications of this satellite-based monitoring approach are vast. The same methodology can be extended to track other harmful air pollutants that impact public health.
Future iterations could include monitoring for:
- PM₂.₅: Fine particulate matter that can cause respiratory and cardiovascular problems.
- NO₂: Nitrogen dioxide, a gas primarily from vehicle exhaust that contributes to smog and acid rain.
- Ozone: Ground-level ozone, a major component of smog that can damage lung tissue.
By integrating these additional data points, cities can develop holistic strategies that address both climate change and immediate public health challenges. This free and open data represents a significant step forward in creating more sustainable, healthier, and resilient urban environments for the future.


